Monitor #
Collect #
做什么 #
- 收到有意义的自动化警报,以解决潜在问题。
- 快速调查并深入了解性能问题。
Collecting data is cheap, but not having it when you need it can be expensive, so you should instrument everything, and collect all the useful data you reasonably can.
Metric #
Metric在特定时间点捕获与您的系统有关的值,
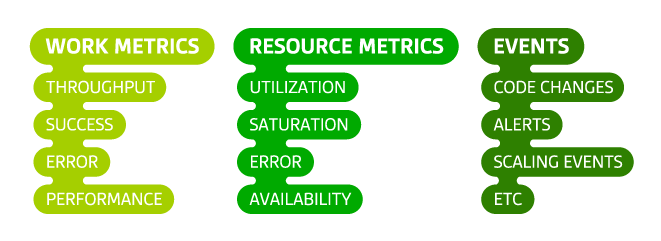
Work Metric #
Work metrics 通过衡量有用的输出来指示系统的顶级运行状况。
- 吞吐量
- 成功率
- 错误
- 性能(延迟)
Example work metrics: Web server
| Subtype | Description | Value |
|---|---|---|
| throughput | requests per second | 312 |
| success | percentage of responses that are 2xx since last measurement | 99.1 |
| error | percentage of responses that are 5xx since last measurement | 0.1 |
| performance | 90th percentile response time in seconds | 0.4 |
Resource Metric #
- 利用率
- 饱和度
- 错误
- 可用性
Here are example metrics for a handful of common resource types:
| Resource | Utilization | Saturation | Errors | Availability |
|---|---|---|---|---|
| Disk IO | % time that device was busy | wait queue length | # device errors | % time writable |
| Memory | % of total memory capacity in use | swap usage | N/A (not usually observable) | N/A |
| Microservice | average % time each request-servicing thread was busy | # enqueued requests | # internal errors such as caught exceptions | % time service is reachable |
| Database | average % time each connection was busy | # enqueued queries | # internal errors, e.g. replication errors | % time database is reachable |
四大特征 #
- 清晰,保持指标和事件尽可能简单,并明确命名
- 粒状,
- 按范围标记,保留与数据关联的多个作用域非常重要,这样您就可以警告任何作用域的问题,并快速调查中断,而不受固定主机层次结构的限制
- 保留时长
总结 #
- 记录一切,并尽可能收集尽可能多的工作指标,资源指标和事件。复杂系统的可观察性要求全面的测量。
- 以足够的粒度收集指标,以使重要的峰值和下降可见。
- 为了最大程度地发挥数据的价值,请在多个范围内标记指标和事件,并将其完整粒度保留至少15个月。
Alert #
告警等级 #
- 记录(低等级)
- 通知(中等)
- 页面、电话等(紧急)
总结 #
仅在系统出现紧急问题的症状时发送页面 检测到工作,或者是否存在关键且有限的资源限制 即将达到
设置您的监视系统以在检测到警报时记录警报 基础架构中的实际问题,即使这些问题没有 尚未影响整体表现
恢复 #
- 查看work指标
- 查看资源指标
- 是否做过变更
- 修复并不忘记它
总结 #
遵循标准化的监视框架,您可以更系统地调查问题:
- 对于基础架构中的每个系统,请提前设置一个仪表板,以显示其所有关键指标并覆盖相关事件
- 通过从显示症状的最高级别系统开始,调查其原因,审查其工作和资源指标以及任何相关事件,以调查问题的原因
- 如果检测到有问题的资源,则对资源(及其组成资源)应用相同的调查模式,直到发现并纠正根本问题为止